Introducing Techops Saver: Smarter Cloud Cost Visibility for Modern Teams
 Credits: TechOps Services
Cloud bills should not be a mystery. We built Saver to give engineering and finance teams a clear view of where their money actually goes across cloud platform — and what to do about it.
Why we built TechOps Saver?
Cloud costs rarely spiral because teams don't care about money — they spiral because no one can clearly explain where the money actually goes.
Over the past few years, we've worked with engineering teams and startups, and almost every one of them has run into the same situations:
- A heart-stopping bill lands at the end of the month, and no one can explain the spike in under ten minutes.
- Existing tools are either prohibitively expensive or only covers for a bit.
We're engineers ourselves, and we know the frustration of staring at a bill and not knowing where to start. So we built Saver to be the tool we'd actually want to open every day:
- Transparent, not a black box. Every optimization recommendation has traceable math behind it. No "the AI said so."
- Readable for both engineers and finance. Engineers get actionable right-sizing recommendations; finance gets structured spend reports, without either side having to translate for the other.
- Minutes, not quarters. Connect an account, trigger a run, and see real numbers in minutes — not at the next billing cycle.
- Build for Multi-cloud
Saver isn't a prettier version of what you already have. It's our answer to a specific problem: putting cloud spend back in front of the engineers who can actually do something about it, instead of leaving it as a month-end surprise.
What Saver does?
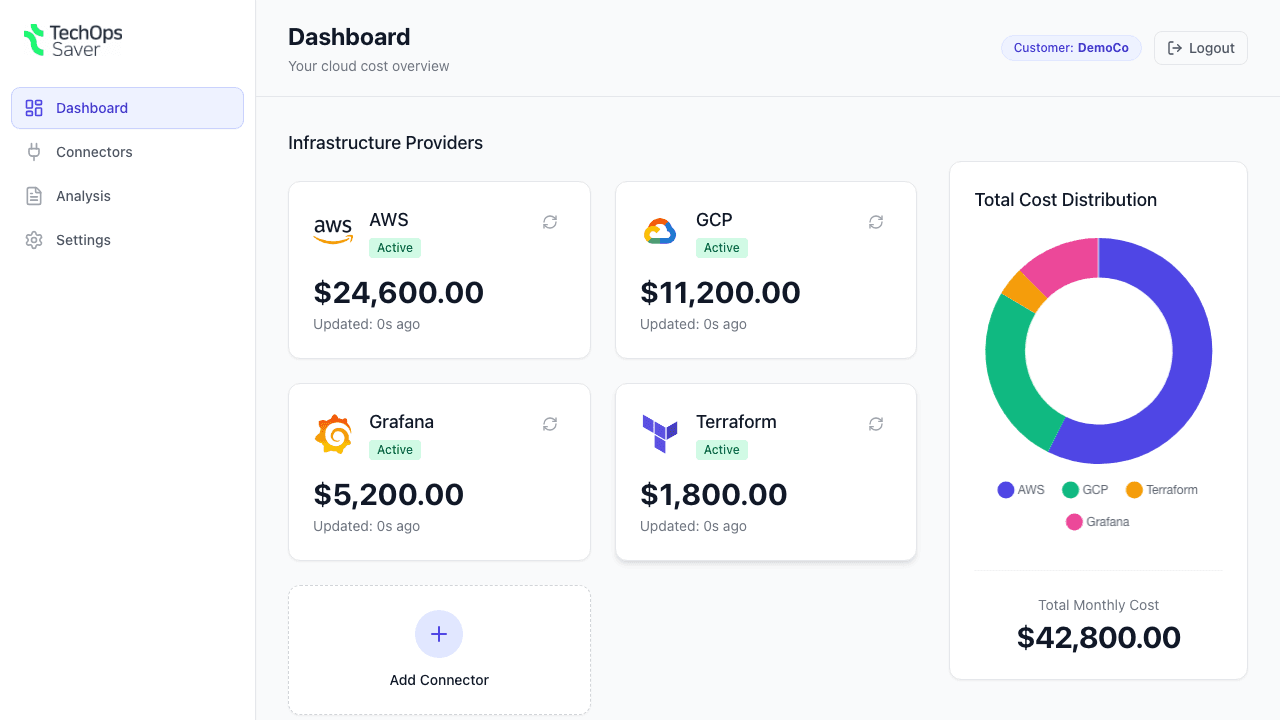
Saver pulls billing data straight from the source — AWS, Terraform Cloud, Grafana Cloud, GCP and Azure (Coming soon) — then runs it through a unified pipeline: ingest → normalize → analyze → report. The result is a clear breakdown of spend, side-by-side service comparisons, and concrete optimization opportunities, delivered as both interactive dashboards and shareable HTML reports.
Features worth highlighting
- Right-sizing analysis for AWS workloads — surface idle and overprovisioned resources automatically.
- Cross-cloud service mapping — see how your AWS spend compares to its GCP equivalent (and vice versa).
- Dashboard snapshots — keep a running pulse on cost per provider without re-running a full report.
- Secure by default — AES-256-CBC encrypted credentials, session-based auth, and strict tenant isolation.
Why it matters
Most cost tools either drown you in raw data or hide the math behind a black box Saver sits in the middle: structured pipelines,transparent analysis, and reports you can actually read.
Saver is live now for AWS, with GCP in active testing and Azure on the way. Connect a cloud account, trigger a run, and see your real numbers within minutes.
Check out our website and video to learn more. You can get early access by joining our discord server.